Logistic regression is an algorithm for binary classification. Logistic regression transforms its output using the sigmoid function to return a probability value between 0 and 1.
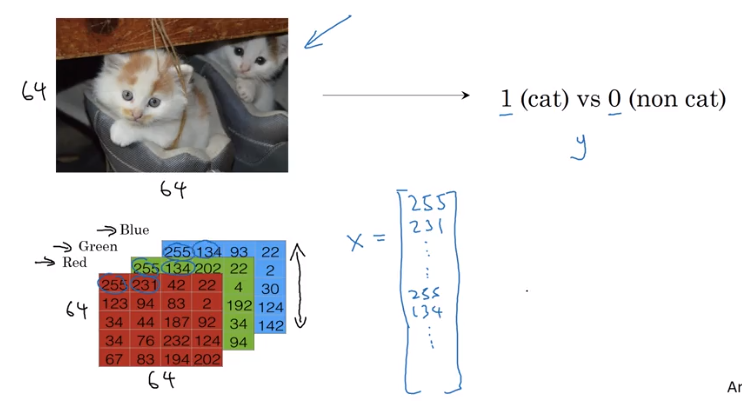
Recognize above image 1 or 0 (non cat)
To turn these pixel intensity values into a feature vector, what we’re going to do is unroll all of these pixel values into an input feature vector x.

If this image is a 64 by 64 image, the total dimension of this vector x will be 64 by 64 by 3 because that’s the total numbers we have in all of these matrixes. Which in this case, turns out to be 12,288, that’s what you get if you multiply all those numbers. And so we’re going to use nx=12288 to represent the dimension of the input features x.
This will have columns,and height will be
x has dimension
x.shape()
so
in python, it can be represented as
Y.shape =(1,m)
Given x, want
If X is a picture, you want to tell you, what is the chance that this is a cat picture.
X is an X dimensional vector, given that the parameters of logistic regression will be W which is also an X dimensional vector, together with b which is just a real number
Parameters: ,
Output
Given parameters, how to generate output?
In linear regression, you would say , but this is not a good algorithm for finding classification, because we want to be a probability between 0 and 1. would produce much bigger numbers.
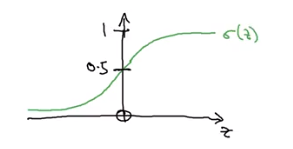
so adding a sigmoid function to the output
sigmoid curve

Sigmoid function can be written as
So if z is large, will be close to 0, so and if z is large negative, then will be a big number, so
The training job is to try to learn parameters W and B so that becomes a good estimate of the chance of Y being equal to one.
When we programmed neural networks, we’ll usually keep the parameter and parameter separate, where here, corresponds to an inter-spectrum.
In some conventions, you define an extra feature called ,where and
is and the rest are